
CPC 8-14 Day Temperature Forecast

CPC 8-14 Day Analog Forecasts
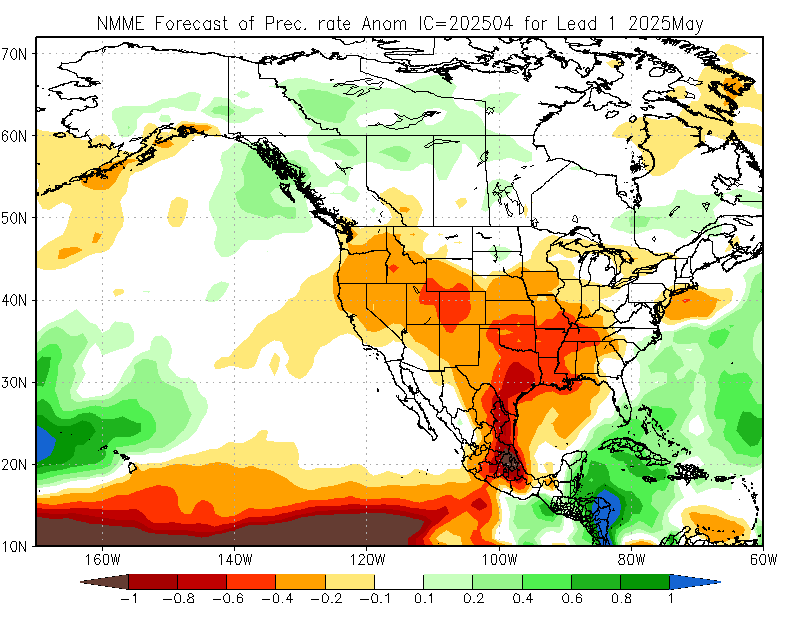
North American Multi-Model Ensemble 1 Month Lead Time Precipitation Anomalies Forecast
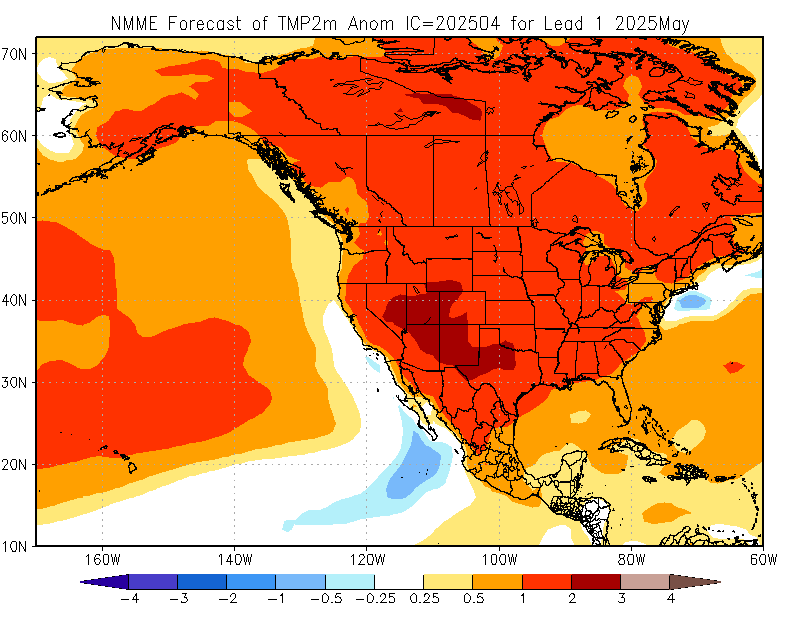
NMME 1 Month Lead Time For 2 Meter Temperature Anomalies 1-month
Experimental North American Ensemble Forecast System 8 to 14 day
Temperature Anomalies
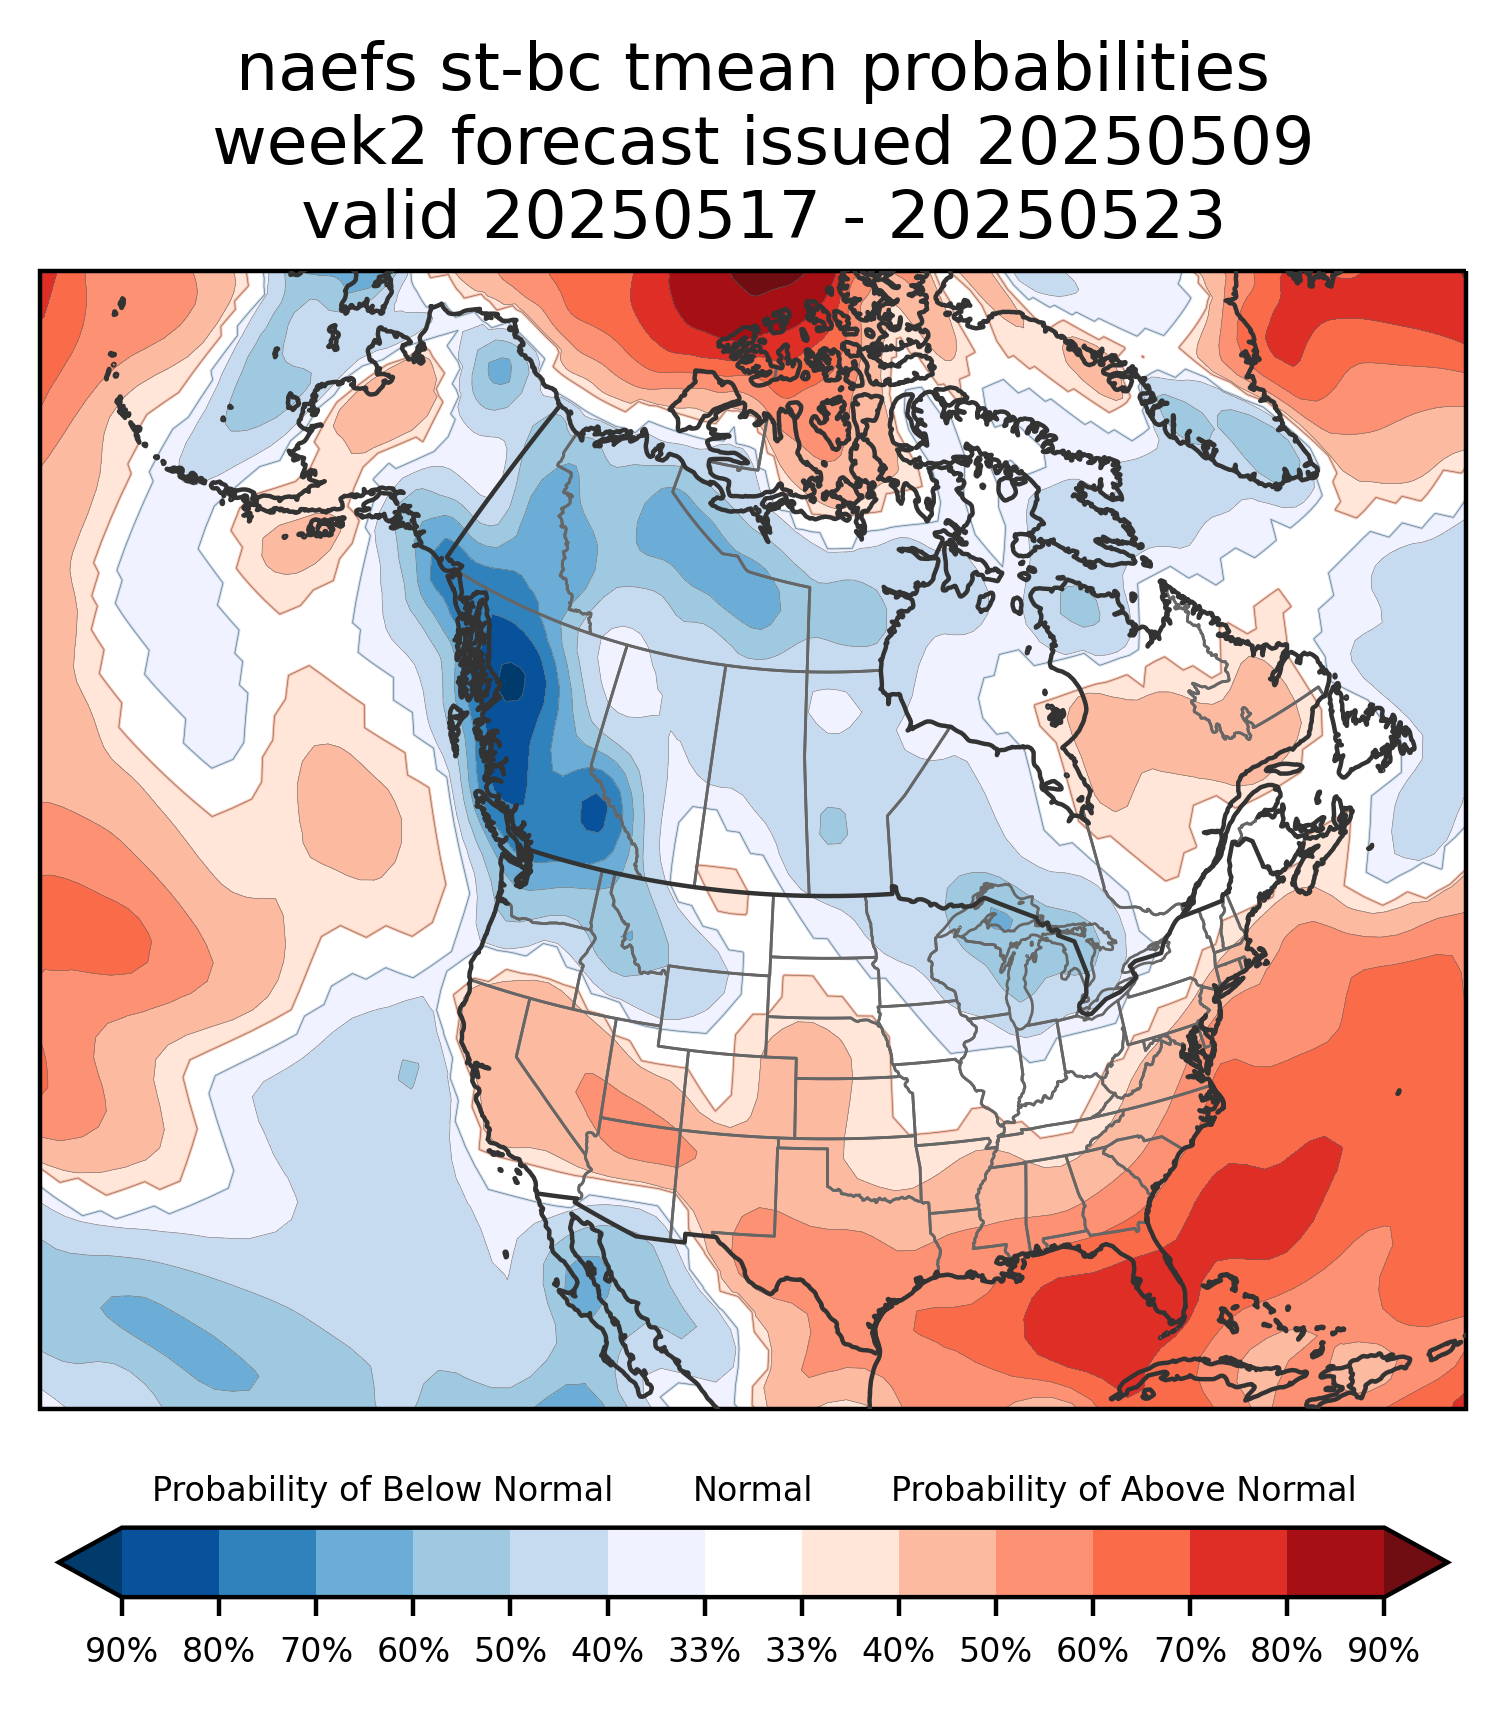
Experimental North American Ensemble Forecast System 8 to 14 day
500mb Height Anomalies

3 Month Average Temperature Outlook For Philadelphia
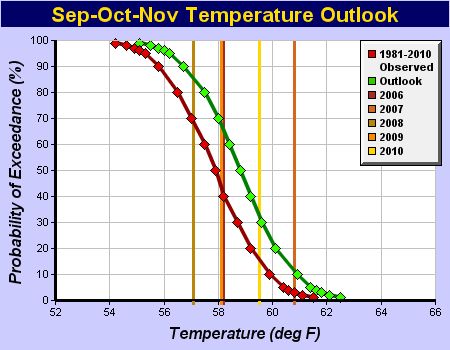
Red line is the 3 month average temperature between 1981 and 2010. The latest 3 month period is shown above. Green line is expected temperature outlook as a percentage vs temperature. For example, there is a middle point of the green curve at 76 degrees, this equates to a 50% chance of exceeding that as an average temperature for the tri-monthly period of JJA. At the bottom edge of the curve, there is almost a 0 percent chance of exceeding an 80 degree average for the tri-monthly period. Generally, we are most likely to have an average temperature between 75 and 77 degrees. That includes daytime and night time temps.
Yearly Tri-Monthly Temperature Outlook for Philadelphia
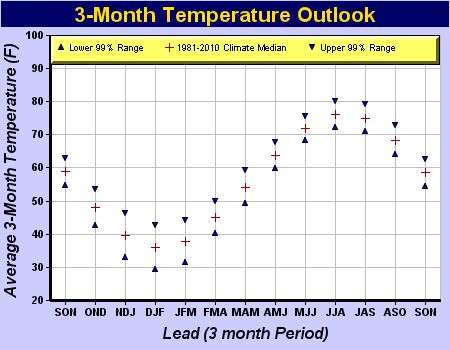
Down arrow represents upper range of 99% confidence interval and up arrow represents lower 99% range. So in this outlook we can see that JJA is expected to be between 72 and 80 with 99% confidence. This graph is primarily based on climotology factors.
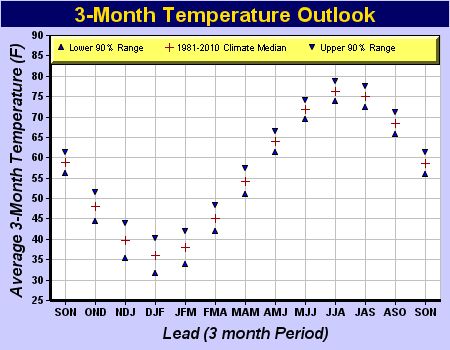
Here is another with 90% confidence interval
CFS Weekly Forecasts:
Weeks 1-4:
CFS Weekly
Monthly Forecasts
| Climate Prediction Center Weekly + Monthly Outlook NCEP | ECMWF Long Range 2m Temp Long Range |
| International Research Institute for Climate and Society IRI | CanSIPS Monthly CanSIPS |
| NMME CPC NMME |
